🎵The Gender Play Gap
Men mostly listen to men whereas women listen to men & women equally
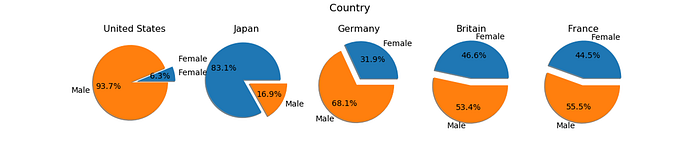
Consistent with previously reported trends (Caruso, 2019; Hayes, 2019), women are balanced in listening to mostly women (31.1%), mostly men (34.5%), or both equally (34.5%), whereas men show a same-sex preference in mostly listening to men (47.2%) with only 18.9% of men listening to mostly women, χ2(2, N = 486) = 7.93, p = .019.
(See methodology at the end)

Music & Bonding — Rentfrow & Gosling, 2006
Music is the most discussed topic when young adults get to know each other.
Indeed, people “consider their preferences for music more revealing of their personalities than their preferences for books, clothing, food, movies, and television shows (Rentfrow & Gosling, 2003)… as music preferences provide unique information about personality that is unavailable through other cues (e.g., photographs, brief video recordings).
[Regarding personality,] music preferences provide unique info about someone’s Agreeableness, Emotional Stability [low Neuroticism], and Openness to Experience, [though] less info about someone’s Extraversion and Conscientiousness.
In work settings, individuals’ impressions of their colleagues are influenced by knowing the content of their colleagues’ music collections [as] info about their co-workers’ music preferences enabled them to develop nuanced impressions about personality characteristics that were not easily derived from other interactions at work (Voida et al., 2005)” (Rentfrow & Gosling, 2006).
Rentfrow, P. J., & Gosling, S. D. (2006). Message in a Ballad: The Role of Music Preferences in Interpersonal Perception. Psychological Science, 17(3), 236–242.
Music & Romance — Treger & Masciale, 2018
Treger & Masciale (2018) “examined people’s preferences for 18 similarity domains in three types of relationships: friendships, casual/short-term, and long-term. The most important similarity domains, across the three relationship types, were political views, career goals, food preferences, travel desires, and music preferences.
Interestingly, single people sought similarity in music more than those in long-term relationships.”

Table of Contents
· Sex & Preferred Sex of Musician (Caruso, 2019)
∘ Luis Aguiar et al., 2021
∘ Chris Melore, 2021
∘ Paul Lamere, 2014
∘ Hannah Sparks, 2021 (Direct Quotes)
· Sidenotes (General)
· Sidenotes on Hypogamy (for a future article)
Sex & Preferred Sex of Musician

The “lack of women in these roles is surprising, given that women are a powerful market for music consumption: women comprised 53% of digital music buyers in 2014” (Smith et al., 2018).
Luis Aguiar et al., 2021
“The US Bureau of Labor Statistics reported in 2020 that 31.8% of musicians and singers were women. See https://www.bls.gov/cps/cpsaat11.htm. On June 12, 2021, everynoise.com reported that 44.1% of Spotify listeners were women, while 22.8% of streams were of music by women. See https://everynoise.com/gender_tldr.html.”
Chris Melore, 2021
“In 2021, the average respondent listened to 26,637 minutes’ worth of content on Spotify — although men edged out women slightly with roughly 3,550 more minutes of listening time (28,184 vs. 24,634).”
Paul Lamere, 2014
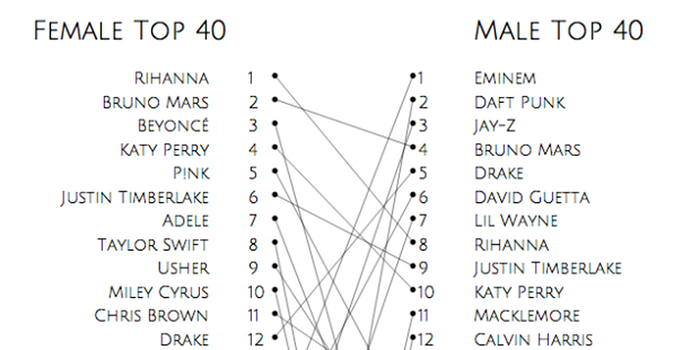
“There are differences in gender listening. For mainstream listening about 30% of the artists in a typical male’s listening rotation won’t be found in a typical female listening rotation and vice versa.
No matter what size chart we look at — whether it is the top 40, top 200 or the top 1000 artists — about 30% of artists on a gender-specific chart don’t appear on the corresponding chart for the opposite gender. Similarly, about 15% of the artists that appear on a general chart of top artists will be of low relevance to a typical listener based on these gender-listening differences.”
Hannah Sparks, 2021 (Direct Quotes)
“Streaming music platforms such as Spotify, Apple Music and iHeartRadio may be giving male artists more airtime, according to a new study that discovered a “widely used” algorithm is more likely to recommend male artists, as opposed to “female and mixed-gender artists.”
An analysis of 330,000 streaming music listeners over a nine-year period showed that only 25% of songs played were led by women. Their observations revealed that “on average,” the platform will start by spinning six tracks by men before choosing a female artist.
“Users had to wait until song seven or eight to hear one by a woman,” wrote Christine Bauer, assistant professor of Human-Centered Computing at Utrecht University in the Netherlands, and Andres Ferraro, Ph.D. candidate at Pompeu Fabra University in Barcelona, Spain. Their work was presented in the Proceedings of the 2021 Conference on Human Information Interaction and Retrieval.
Just 23% of artists appearing on the 2019 Billboard Top 100 were not men, according to an unrelated study. Researchers also noted in the article that less than 20% of registered songwriters and composers are women, while 98% of music performed by prominent orchestras is composed by men.
In a previous report of listeners’ interests, researchers at Spotify and Harvard University found that the disparity between artist genders varied widely by genre: 95% of rap and hip-hop streams were male-only groups and performers. For pop, as much as 40% of spins were female artists or groups that included at least one woman. By contrast, metal fans listened to women wail a mere 0.7% of the time, and nonbinary artists at a rate of 7%.
Bauer and Ferraro suggest that the radio can be retrained to play fewer men over time by creating a positive feedback loop, starting with the streaming service. By retooling the algorithm to forcibly rank men lower in a playlist, a simulation demonstrated that, eventually, the listener would begin choosing more female and nonbinary artists of their own volition, signaling to the machine to integrate more non-male artists. And so on.
The authors hope that this sort of strategy may be considered as a means to correct certain biases in artificial intelligence, particularly in terms of race and ethnicity. Popular dating apps, for example, have been accused of stealing swipes from people of color. For minority groups, the trend can also be a detriment to their health, when clinical software favors white patients over black.”


Sidenotes (General)
Previous scholarship suggests that negative portrayals of Asian men’s masculinity (Espiritu, 1997) and black women’s femininity (Collins, 2004) may shape the exclusion of these groups.
China: Han & Zhao, 2021 — One Child Policy & Leftover Men/Women
According to the theory of “grading by grading in matching” in sociology, male mate preference tends to find “low,” while that of female tends to find “high.”
Even if China’s sex ratio is imbalanced and there are a large number of marriageable men,
these highly educated women cannot choose men whose overall level is far below their own.
Stepmothers (Day, 2019)
“Compared to stepfathers, stepmothers have more difficulty establishing close, meaningful relationships with their stepchildren (Stewart, 2007)”
Research shows that Christian women, in particular, are more likely to remarry and often do so more quickly than their nonreligious counterparts (Brown and Porter, 2013; Xu and Bartkowski, 2017).
Stepfamilies — China — Yang Hu, 2020
In mainland China, the annual rate of divorce has increased by nearly eight times from .4 in 1985 to 3.0 in 2016. Mothers’ remarriage is associated with a broader range and greater extent of damage to children’s well-being than that of fathers.
Becky L. DeGreeff & Ann Burnett, 2017
First, growing numbers of children and adolescents are raised in families that do not include both family-of-origin parents due to divorce, remarriage, or single parenthood (Allen, Blieszner, & Roberto, 2000; Stepfamily Foundation, 2017). Second, life expectancy is increasing, resulting in the presence of grandparents in the lives of children well into young adulthood (Arber & Timonen, 2012; Zullo & Zullo, 2004). The combination of these two factors increases the likelihood that stepgrandparents (SGPs) become part of the stepfamily system as single and divorced parents and/or grandparents recouple or remarry.
Over 50% of families in the United States are remarried or recoupled (Stepfamily Foundation, 2017).
Ozawa & Yoon, 2002
One goal of the Temporary Assistance for Needy Families (TANF), part of the Personal Responsibility and Work Opportunity Reconciliation Act of 1996 (P.L. 104–193) is to encourage welfare mothers to remarry on the assumption that marriage is an easy way out of welfare dependence for many women on welfare.
Among all the marriages that are registered, 22.5% involve either a groom or a bride who was divorced previously and 23.4% involve a groom and a bride who were both divorced previously.
Interracial Custody
USA — Kathryn Beer, 2011
In Davis, decided in 1983, Pennsylvania’s Supreme Court ruled on an appeal from the trial court’s award of custody of a biracial child to a Black couple over a White couple. The court noted that the award of custody to guardians who share the race of the child would help establish the child’s personal and social identity. 🤦🏻♀️
Like Gambla, Davis was decided based upon courts’ reasoning that a child’s interests are better served when custody is awarded to a guardian more racially similar to the child because that guardian can more adequately promote the child’s self-acceptance and emotional growth. 🤦🏻♀️
Canada — Boyd & Dhaliwal, 2015
The most significant pattern in our case law study was that race is rarely found to be the key factor and the racialized parent is not favored in custody cases involving multiracial children. Indeed, sometimes race is not even discussed in such cases.
— Blackwood, 1985
The Florida court had transferred custody of a young child from her mother to her father, ruling that the mother’s interracial remarriage violated the child’s best interests.
Nurturer’s Last Name (Bartholomay, 2019)
In same-sex households the child may take the last name of the parent who spends more time at home with the child so that it’s easier to interact with day care, schools, etc
Since the breadwinning spouse is less likely to spend as much time with the child, it doesn’t make sense for the family to change their name to the breadwinner’s last name.
Sidenotes on Hypogamy (for a future article)
Via Chudnovskaya & Kashyap, 2020 & Potarca & Rossier, 2022
“Driven by the rapid increase in women’s higher education in recent decades, couples in which women are [the more educated lover] are currently on the rise (Esteve et al., 2012, 2016; Van Bavel et al., 2018).
Across the United States and most European countries, the prevalence of educational hypogamy (women ‘partnering down’) now exceeds that of educational hypergamy (men ‘partnering down’) (Esteve et al., 2016; De Hauw, Grow and Van Bavel, 2017).
When women ‘marry down’ in terms of education, they tend to marry men who earn more than them (Qian, 2017).


Hypogamous women are also more likely to belong to demographic groups with more depression-prone inherent traits, such as cohabiters or divorcees (Idstad et al., 2015; van Hedel et al., 2018), [which is partially associated with] the potential mental health selectivity of individuals in cohabiting versus marital unions (e.g. Perelli-Harris and Styrc, 2018). Mentally distressed individuals are more likely to be selected out of marriage (Idstad et al., 2015). [Thus, one reason why hypogamous unions may have been more likely to divorce in the past may be because] highly educated women in hypogamous arrangements were indeed more depressed than those in homogamous couples” (Chudnovskaya & Kashyap, 2020).
The effect was partly due to greater economic difficulties, identified by previous studies as important depression risk factors (Van de Velde et al., 2010; Gonzalez and Vives, 2019). Though not directly tested, additional reasons why highly educated women partnering down were more vulnerable to depression include a potentially lower level of partnership quality (Zhang et al., 2012) or a heavier double burden (Jurczyk et al., 2019) given longer working hours, gender-restorative compensation behaviors, or men’s greater resistance to an egalitarian division of household tasks when lower educated.
“In environments with increased exposure to women holding greater symbolic power, pioneering male partners who take on more domestic work become the new norm, and are quickly followed by the mass of highly educated men.”
Methodology
Of your top 7 artists or songs on iTunes or Spotify, how many of them are women/men?
A. 7 women 🎵
B. 6 W & 1 M
C. 5 W & 2 M
D. 4 W & 3 M 🎼
E. 3 W & 4 M 🎼
F. 2 W & 5 M
G. 1 W & 6 M
H. 7 men 🎵
Note
If your top 7 songs include several songs by the same person, then count that person each time.
If your top 7 songs include vocaloid 🤖, count it based on if the Ai/robot voice is female or male.
If your top 7 songs include trans musicians, Transwomen are women & Transmen are men.